In his famous quote, Nelson Mandela stated that “Poverty is not an accident like slavery and apartheid, it is man-made and can be removed by the actions of human beings.”
In 2015, Kenya was ranked 6th among the top 10 countries in the region South of Sahara and North of River Limpopo with many people living in extreme poverty.
As per the UN definitions, poverty is considered as the lack of income and resources necessary to ensure a sustainable livelihood. It is evident through occurrences of issues such as hunger, malnutrition, limited access to education and basic services, social discrimination & exclusion and lack of participation in decision-making. The Sustainable Development Goal 1 aims at ending all forms of poverty.
2017 has been an election year, and we are still scheduled for another election. Do poverty levels have any effect on voters’ registration and participation in the election?
Poverty level per county in Kenya
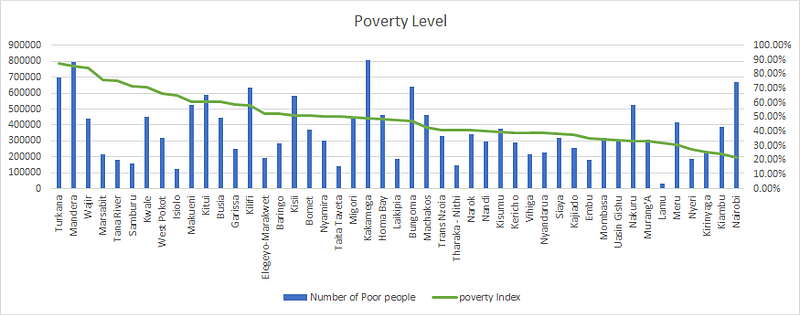
The above data indicates that Turkana had the highest poverty level as per the headcount poverty index with 87.5%. The poverty level in the leading four counties, Turkana (87.5%), Mandera (85.8%), and Wajir (84.2%) is four times higher than the poverty index level in Nairobi (21.80%).
The counties with the highest absolute number of people living in poverty are Kakamega (809532), Mandera (796103), Turkana (701303), Nairobi (668787), and Bungoma (643316).
Poverty level Vs. Registered voters
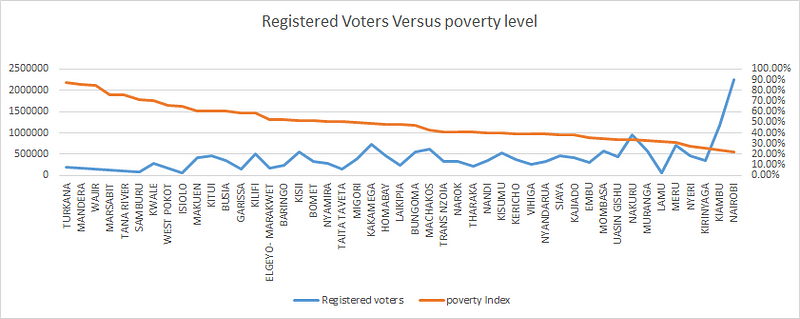
The pattern illustrated above points out to an indirect proportion between number of registered voters per county and poverty. There are more registered voters in most counties with lower poverty levels. Lamu County is an outlier in this case as Lamu has a lower poverty level and low number of registered voters.
Poverty level and voters enrollment rate
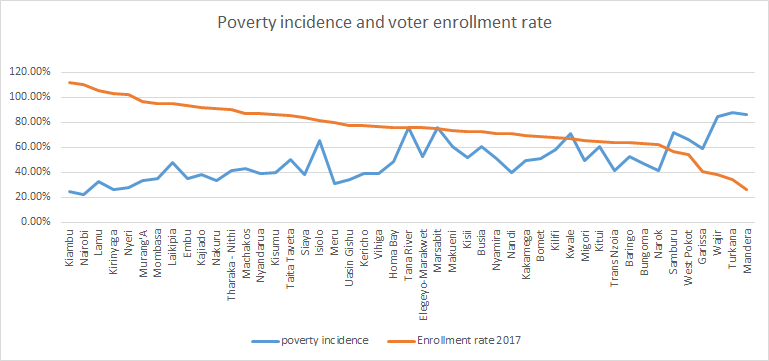
The voter enrollment rate considers the number of voters registered against the target set by the electoral body for the same county. From the graph above, it is evident that counties with the highest enrollment rate of voters had the least poverty levels (Kiambu had enrollment level of 111.90% and poverty incidence of 24.20%, Nairobi had enrollment of 110.31% and poverty incidence of 21.80%) while the countries with lowest enrollment rate had the highest rates of poverty incidence (Turkana had enrollment rate of 34.25% and poverty incidence of 87.5% and Mandera had enrollment rate of 26.26% and poverty incidence of 85.8%.
This is likely indicator that poverty is one of the factors inhibiting eligible people from registering as voters. This is an important aspect that requires further exploration.
Poverty levels and Change in registered voters
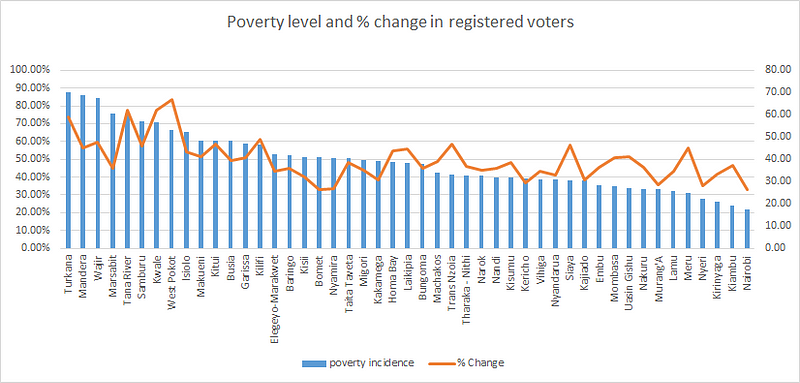
The change in registered voters compares the registered voters in 2017 and 2013. From the graph above, it can be noted that most counties with high poverty levels experienced high levels of change in registered voters.
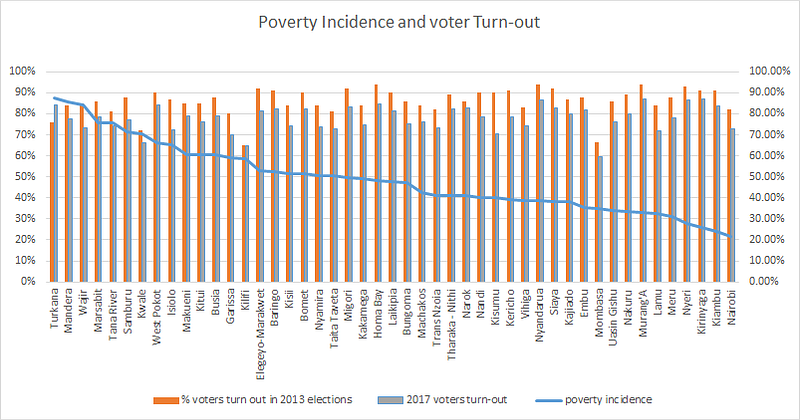
Poverty incidence and voters turn out
The graph below shows voter turnout during the last two elections and poverty index levels. It seems that most counties with highest voter turnout during the elections had relatively lower poverty levels apart from Turkana that had high voter turnout but also had highest poverty level. Most counties with high poverty levels had relatively lower voter turnout.
Conclusion
From the discussion and data presented above, it is clear the poverty is still an issue in Kenya. Twenty counties have been indicated to have poverty levels greater than 50%. Turkana takes the lead with a poverty of 87.50% affecting approximately 701303 individuals.
There seems to exist an almost inverse correlation between the poverty level and registered voters in the respective counties where counties with high poverty level had least number of registered and counties with low poverty levels having high number of registered voters. Nairobi and Lamu counties are the most noticeable outliers from this relationship.
An inverse relationship was further observed between poverty levels and voters enrollment rate. In counties with low poverty rates, the electoral body managed to exceed or almost attain the targeted number of voters in the voter registration process. It has been showed that in areas with highest poverty rates, the difference between voters registered and the target number was highest. Also participation in the election process was observed to be minimal in counties with high poverty levels.
It is can therefore be alluded that, high poverty levels inhibits to some extent the participation of people in exercising their civic right of voting.
Disclaimer: Correlational relationship between two variables does not necessary imply the existence of a causal relationship